Notes on the Statistical Data for Front Feet Shown in our Reports
The statistical distributions shown in our reports differ for front feet and hind feet. This page documents definitions and statistics for front feet (a similar page for hind feet is here). To gather this information, we used tens of thousands of images from more than 60 veterinary clinics from around the world. Of these, our current reports use data from about 7,000 unique front hooves. We believe these are an accurate sample of the population of “horses radiographed by veterinarians”. Hence, the population includes horses with issues, but also images from pre-purchase exams, and images taken for shoeing/trimming purposes. Our only edit made to the raw image data was to remove images in which large wedge-pads or other angulation-changing devices were employed; hence images are barefoot horses or flat-shod horses.
In the distribution graphs, we color the central 70% of horses in green, and show 15% of horses with low value in red, and 15% of horses with high value in red. Roughly speaking, we can say if the value falls in the green range, the measurement is ‘normal’ in the sense that it is in the range we observe for 70% of horses in our population. ‘Normal’ may differ from ‘Ideal’, but ‘Ideal’ is always more or less subjective. By showing actual measurements of a large number of horses, we get a feel for what is ‘Normal’, and our data is quite objective, and can be used by practitioners with varying belief systems.
Note that image-based measurements give a great evidence base for treatments but are not the whole story. These measures do not capture attributes of soft tissue (bruising, scars, etc) nor the details of the usage of the horse, or past medical history. All clinically relevant data should be used when diagnosing and treating.
Palmar Angle
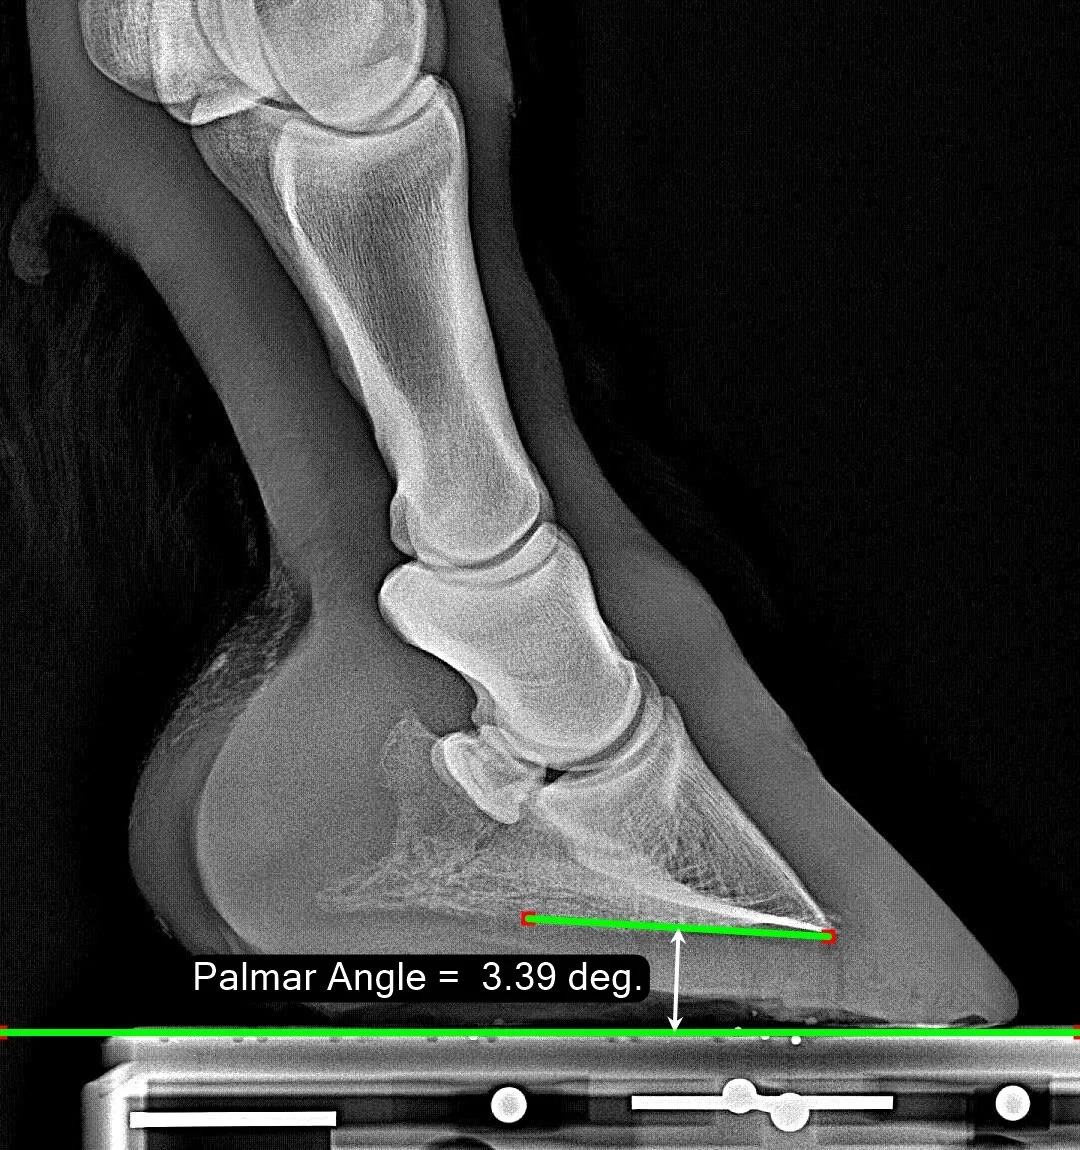
The Palmar Angle describes the shallow angle between the bottom of P3 and the ground. It grows more positive as the heels are raised. If the heels are very low, the Palmar Angle can become negative.
Normal Range
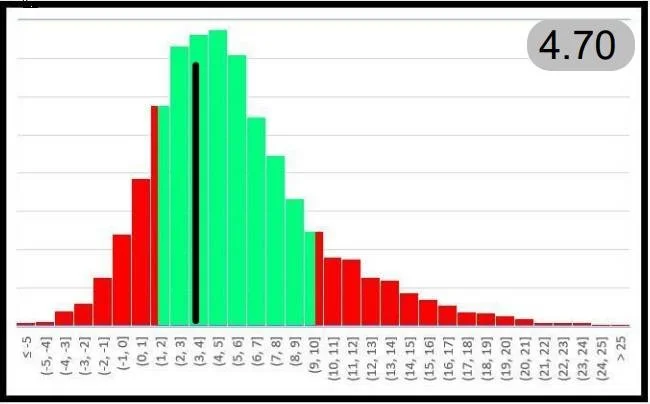
Our ‘normal range’ is from 1.3 degrees up to 9.7 degrees, with the median at 4.7 degrees. The black vertical line shows the value for this image. Our reports also show the Palmar Angle on page 1 with the distribution colored by quartiles. More on Palmar Angle.
P3 Descent
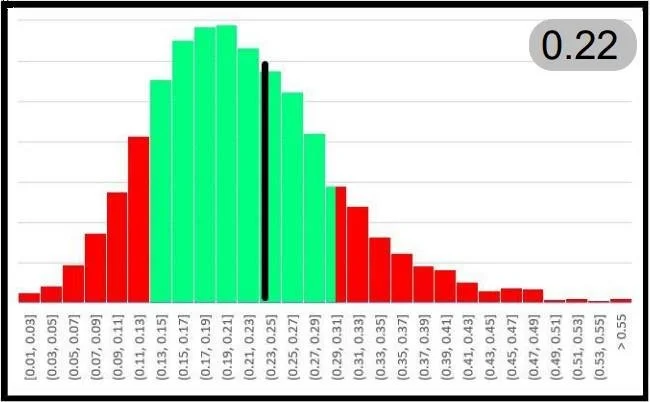
‘P3 Descent’ is the vertical distance from the hairline to the top of the extensor process of P3. Some publications have called it the ‘Founder Distance’. A large value may indicate that the bone is sinking within the capsule, so smaller values are desirable. Support under the foot may aid to stop or reduce the rate of sinking.
Normal Range
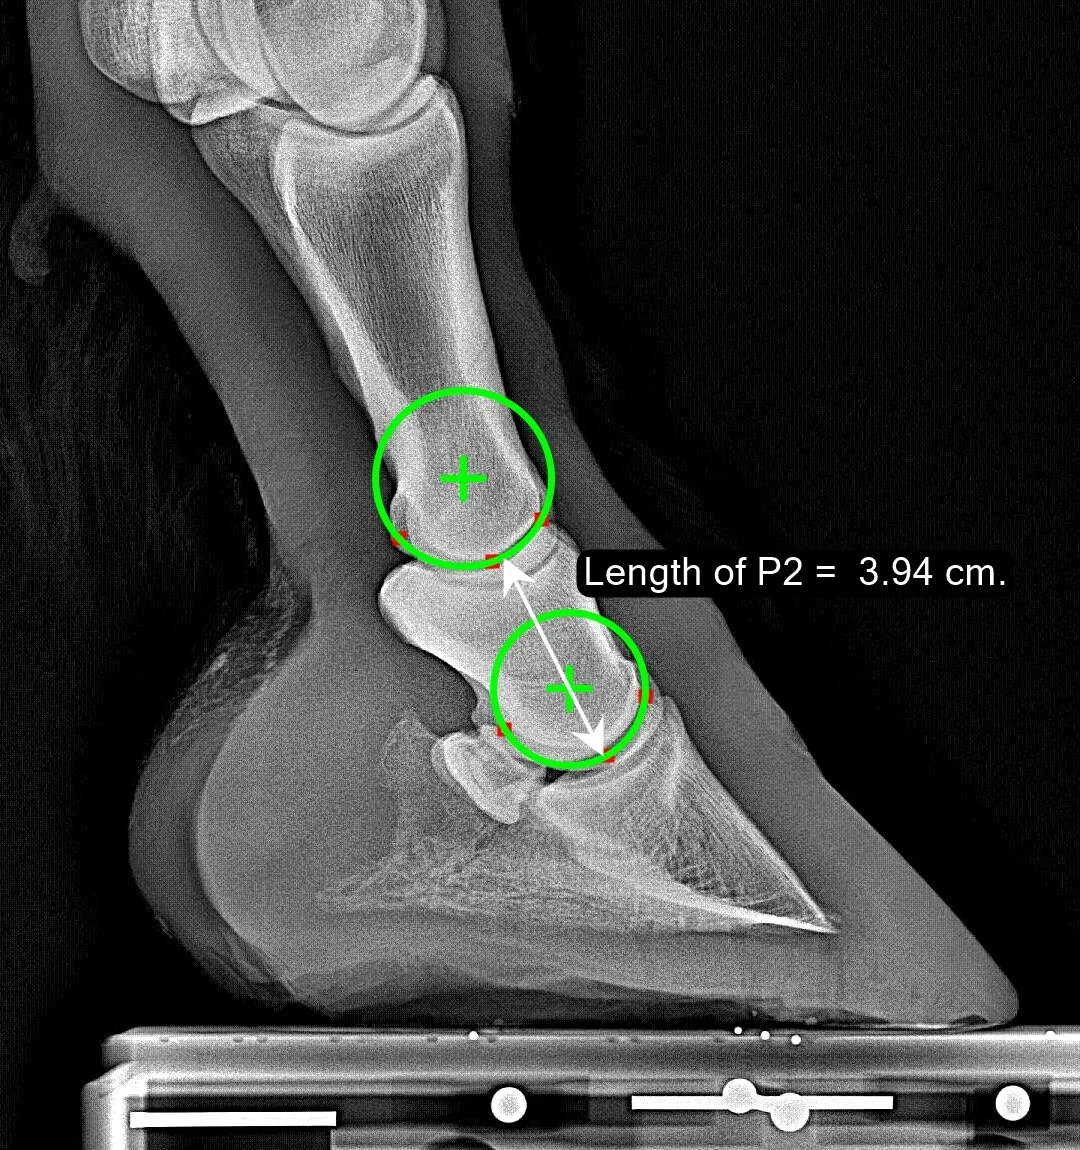
For linear measurements, we scale the value by the ‘length of P2’ which for this image was 3.94 cm. By scaling, we can compare values that are independent of the size of the hoof. The ‘normal range’ is 0.13 to 0.30, with a median of 0.22. That is, 22% of the length of P2 is a normal value for this measure.
P3 Distance to Ground
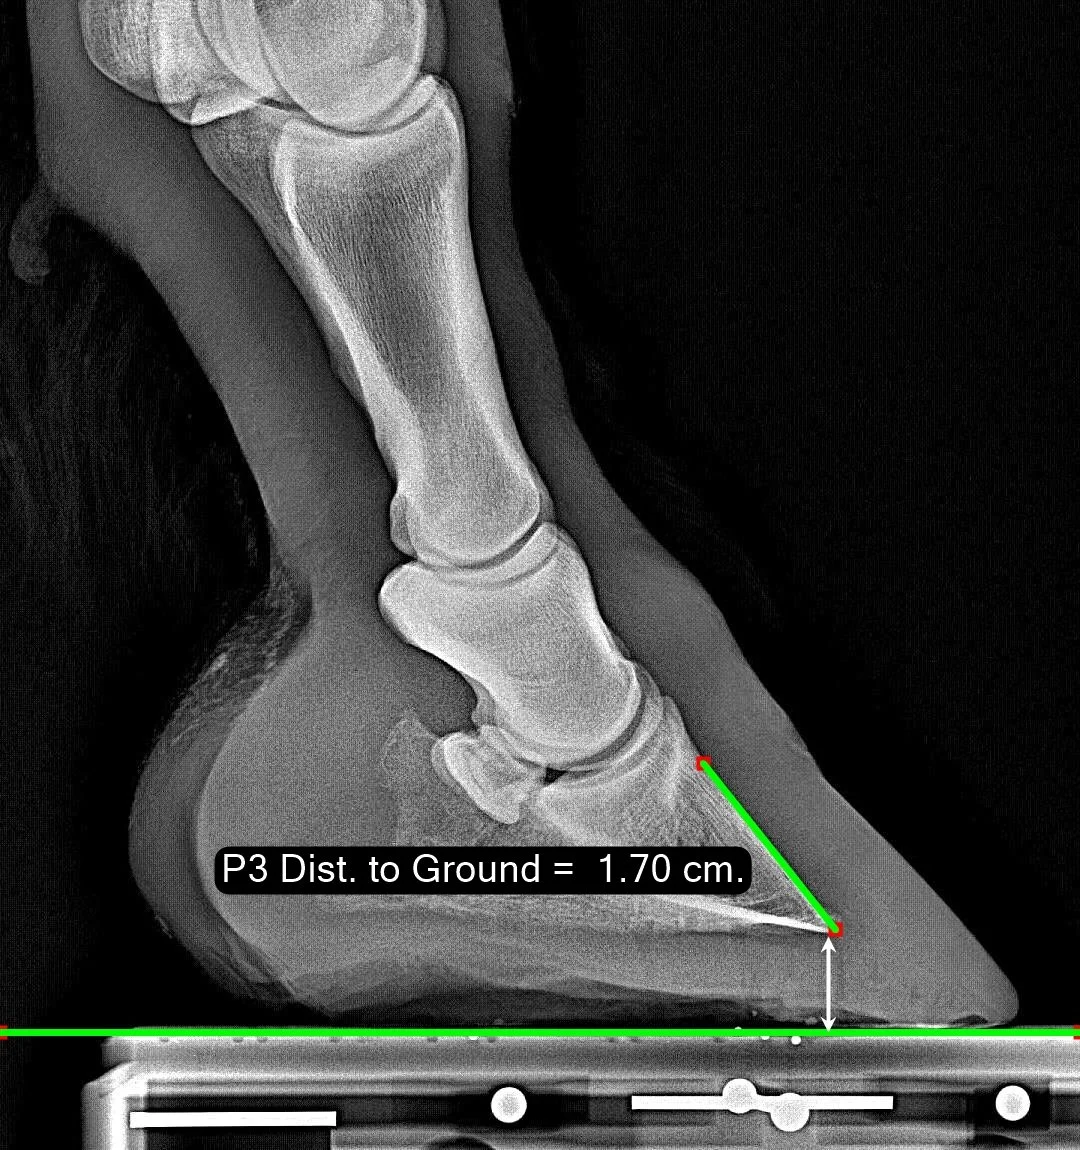
This measure is related to sole thickness beneath the tip of P3. Due to varying quality of radiographs, we have not felt that we should expect to be able to see the underside of the actual sole, so rather than trying, we measure “distance to ground” to give an estimate of sole thickness conflated with concavity of the sole. We do not want this measure to be too small.
Normal Range
If you look carefully at this distribution, you will see that it appears to be two ‘bell curves’ superimposed. This is because a portion of our database was barefoot, and a portion had a shoe - which raised the ‘P3 Distance to Ground’ by the shoe thickness. Again, this linear measure has been scaled by the length of P2. This histogram is not shown in our reports due to the possible confusion it might cause with shod-vs-barefoot.
Hoof Angle
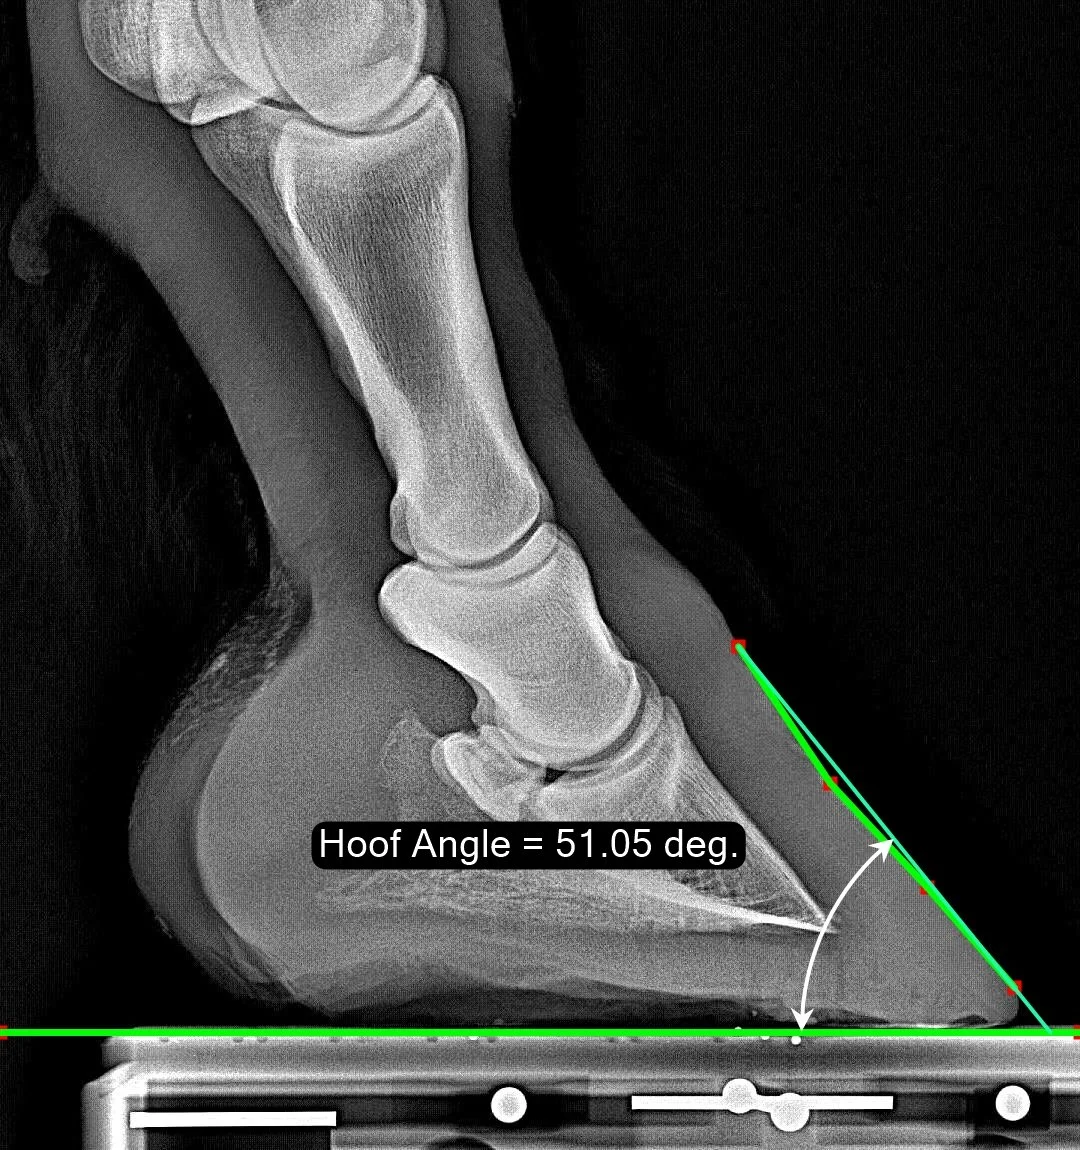
The Hoof Angle measurement is measured as if a physical gauge was laid across the dorsal wall of the hoof starting at the coronary band. This means that a “dish” if the hoof is spanned (as you see in this sample image). On a bull-nosed hoof, this scheme may underestimate the Hoof Angle. The Hoof Angle is only perfectly defined when the dorsal hoof wall is straight.
Normal Range
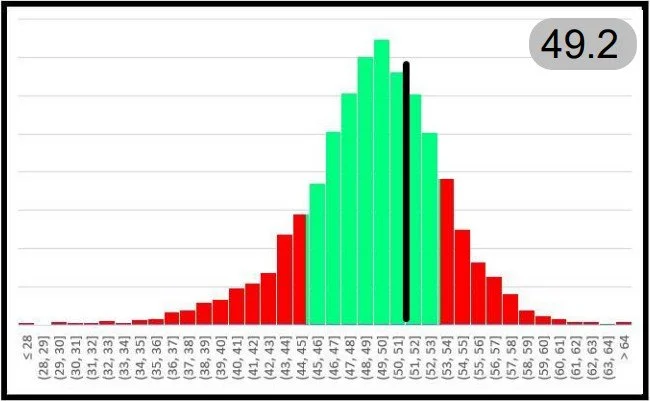
The ‘normal range’ observed in the population ranges from 45 degrees to 53 degrees, with a median of 49.2 degrees.
Proximal HL Zone
The Proximal Hoof-Lamellar (HL) Zone measures the distance from the dorsal aspect of the P3 bone just below the extensor process out to the outer hoof wall. It is measured perpendicular to the face of P3.
Normal Range
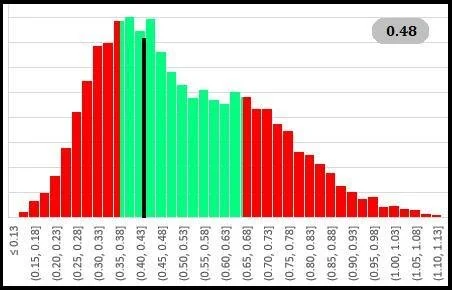
Because this is a linear measurement, in our population distribution graph we divide the distance by the length of P2. For this example image, this yields the value 0.42. Our normal zone is from 0.35 to 0.47 with a median value of 0.43 - so this example is quite near the median. A normal value is 43% of the length of P2.
Distal HL Zone
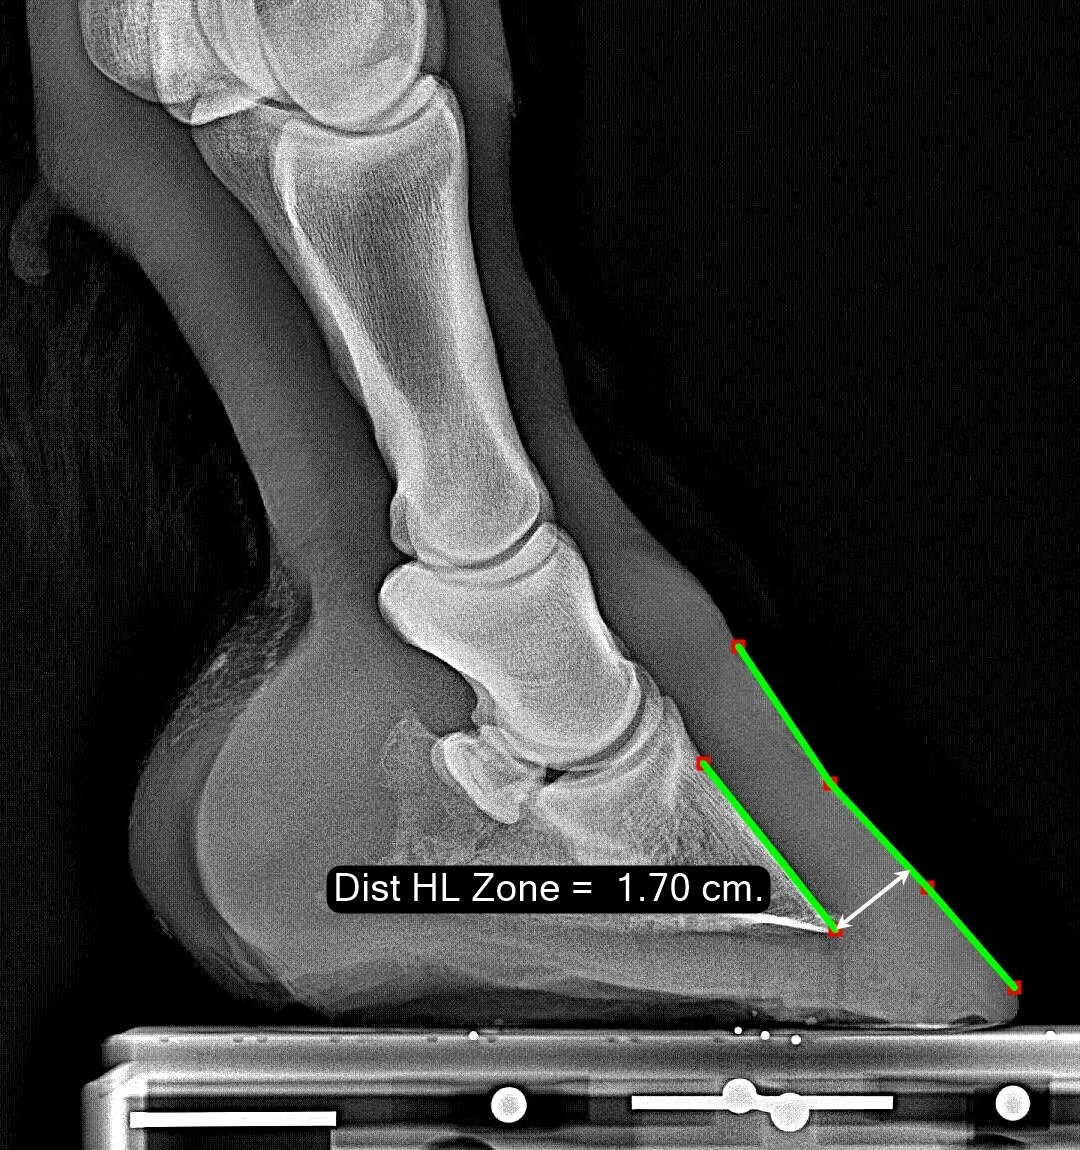
The Distal Hoof-Lamellar (HL) Zone measures the distance from the dorsal aspect of the P3 bone at its tip out to the outer hoof wall. It is measured perpendicular to the face of P3.
Normal Range
Because this is a linear measurement, in our population distribution graph we divide the distance by the length of P2. For this example image, this yields the value 0.43. Our normal zone is from 0.34 to 0.57 with a median value of 0.44 - so this example is quite near the median. A normal value is 44% of the length of P2.
Toe/Support Percentage
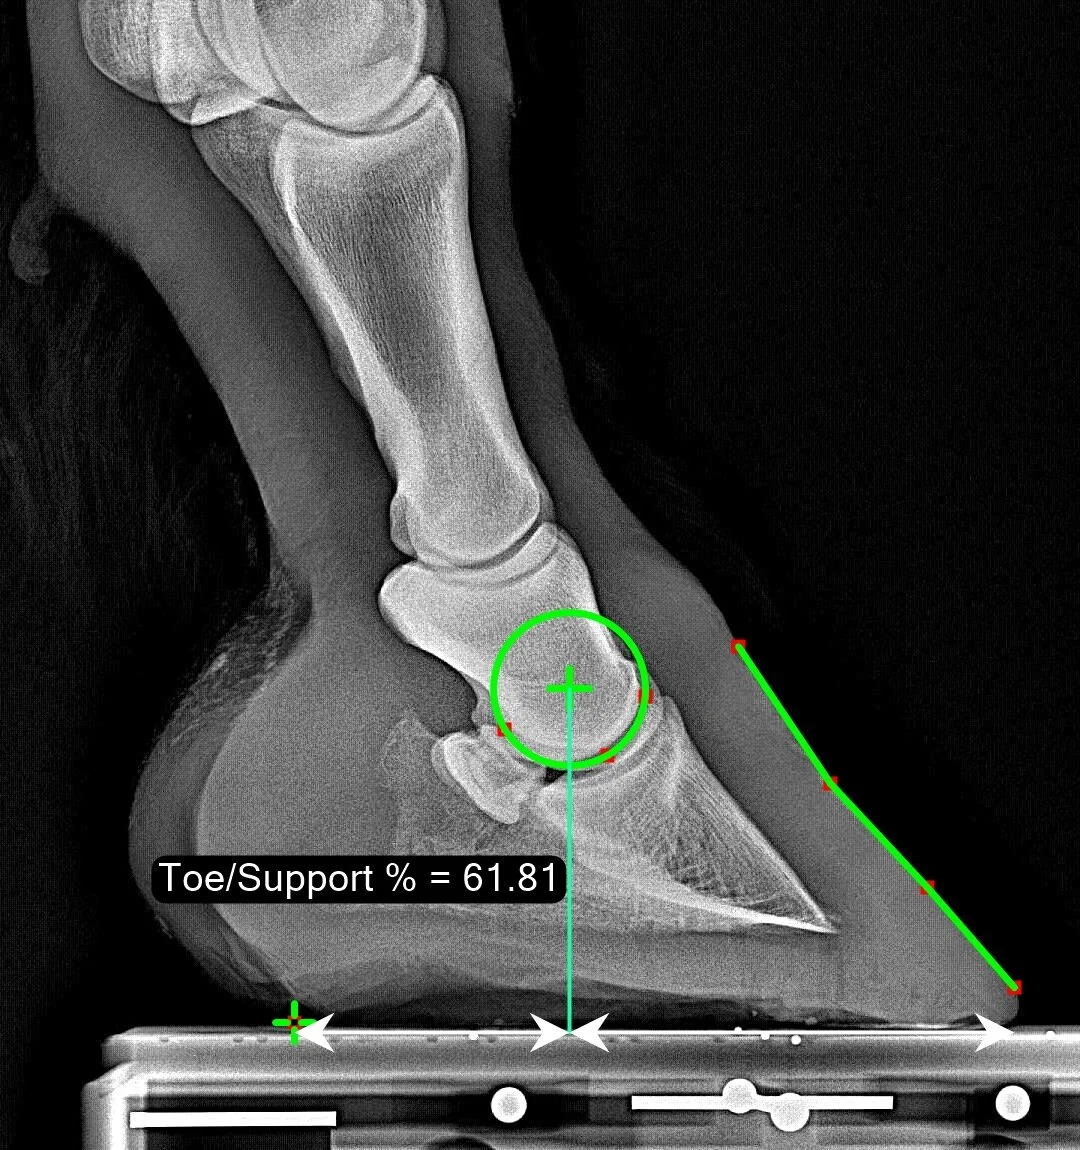
The Toe/Support Percentage is measured as follows: a vertical line is dropped down from the center of articulation of the coffin joint. Then we measure the percentage of the ‘support length’ of the foot which lies ahead (cranial) to this line. The ‘support length’ extends from the most caudal point where the hard heel meets the ground, up to the most cranial part of the hoof. In the case of a ‘toe bevel’ this might be defined differently but note that we extend it past where the bevel begins and go all the way to the most cranial tip of the hoof. This measure can be thought of as a biomechanically-inspired measure of toe length. A larger value means a longer toe, and a bigger lever arm during breakover.
Normal Range
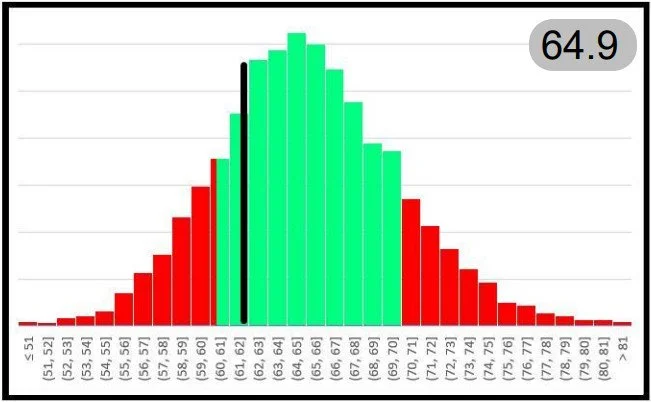
The normal range we observe is from 60.3% up to 69.8% with a median of 64.9%.
Coffin-Joint Angle
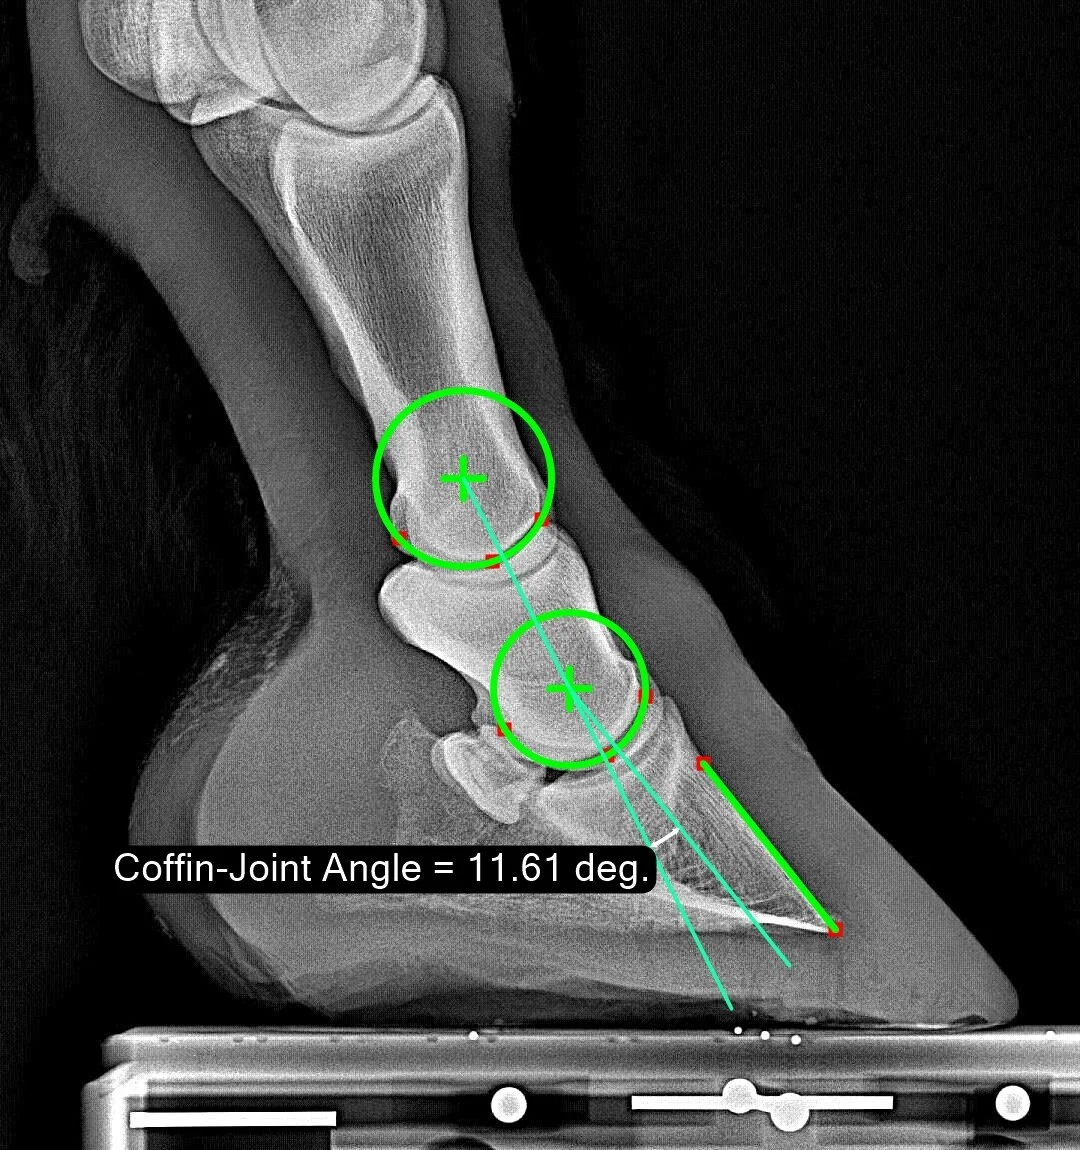
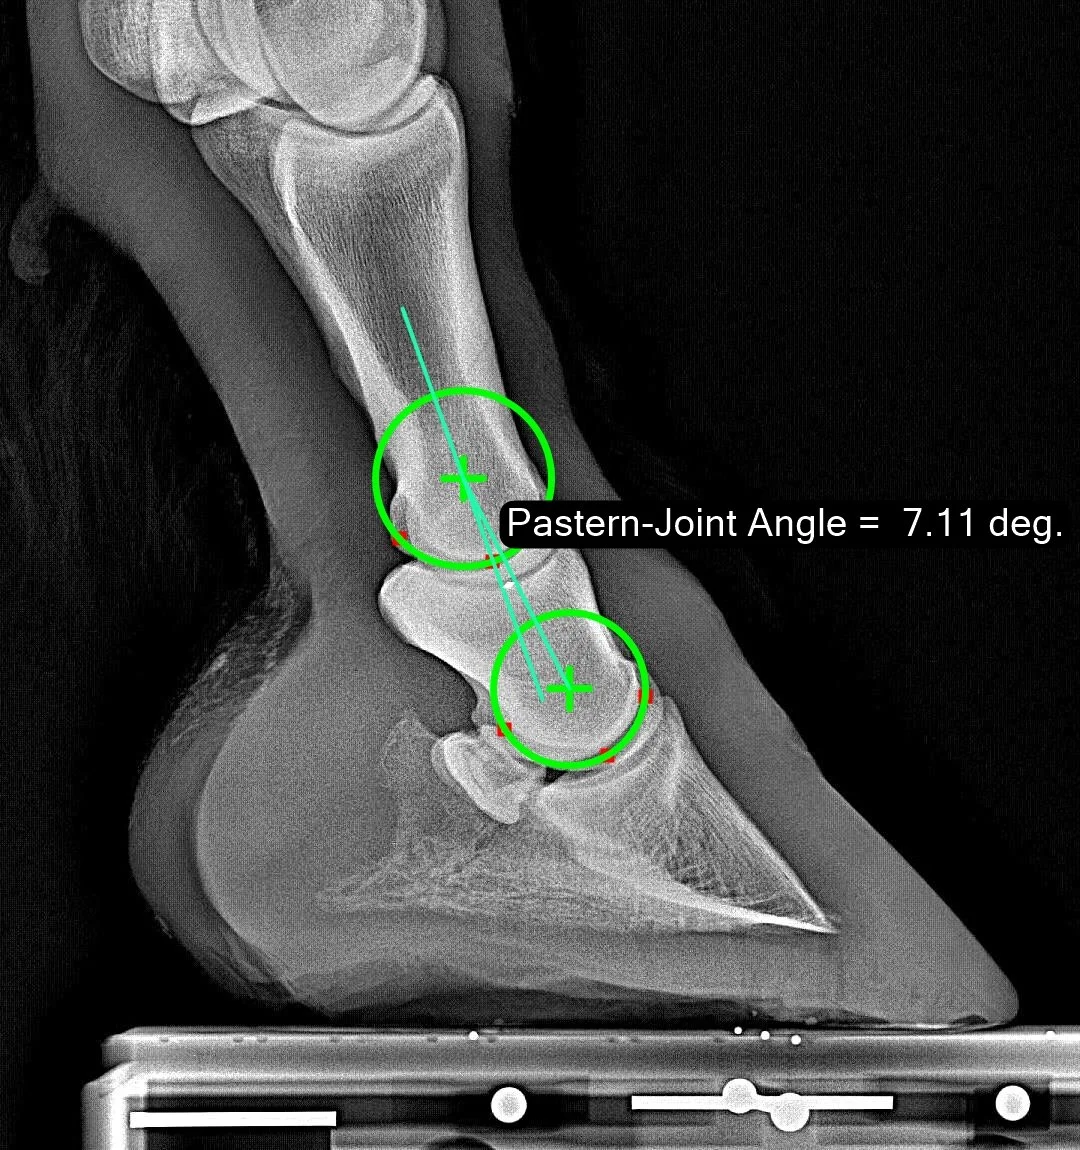
The Coffin-Joint Angle measures the angulation between the P2 and P3 bones. To be precise, it is measured as follows: construct a line connecting the rotation centers of the pastern and coffin joints. Then measure the angular difference between that line and the parietal surface of P3. The details are discussed in this publication. To repeatably quantify a given leg/hoof, it is important to stand the horse with cannon bone approximately vertical when imaging.
Normal Range
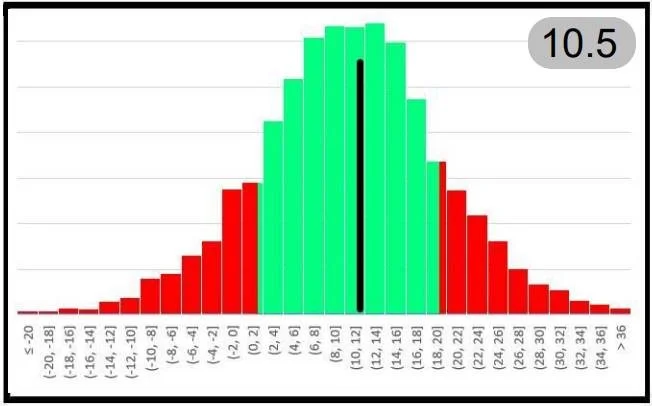
The observed normal range is from 2 degrees to 18.5 degrees with a median of 10.5 degrees. This means it is normal (in our population) to be ‘broken back’ by about 10 degrees. Therefore, the angulation shown in this sample image is very close to the median. The larger the value, the more ‘upright’ the pastern.
Pastern-Joint Angle
The Pastern-Joint Angle measures the angulation between the P1 and P2 bones. To be precise, it is measured as follows: construct a line connecting the rotation centers of the pastern and coffin joints. Then measure the angular difference between the centerline of the P1 bone and that line. The details are discussed in this publication. To repeatably quantify a given leg/hoof, it is important to stand the horse with cannon bone approximately vertical when imaging.
Normal Range
The observed normal range is from 0 degrees to 8.9 degrees with a median of 4.5 degrees. The larger the value, the more ‘upright’ the pastern. At 7.1 degrees, this sample shows a somewhat more upright (or ‘broken-back’) pastern joint angle than average, but still within our 70%-of-all-horses normality zone.
Length of P2
The Length of P2 is used in our system to scale any linear measurements to remove the dependence on hoof size. This way, we can make statements like “it is normal for the P3 Descent value to be 22% of the length of P2.” Note that the length of P2 as we have defined it is unaffected by the stance of the horse and is unaffected by trim alterations to the hoof. The precise definition is: measure the distance between rotation centers of the pastern and coffin joints, then add the radius of the coffin-joint circle and subtract the radius of the pastern-joint circle. The result (drawn in white below) is the ‘Length of P2’.
Normal Range
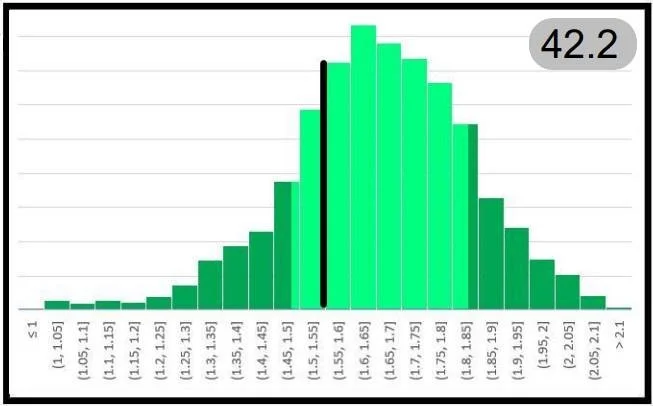
The 15% wings of our distribution graph are not colored red for this parameter, as there nothing wrong with being a small horse or a large horse. We see that the median horse has a P2 length of 42.2 mm (1.66 inch).
Note: Internally the Metron hoof measurement system actually defines 22 different measures for the lateral hoof radiograph. In the recent evolution of Metron we decided to simplify down to the most important 10 measures, so as not to overwhelm our users. But additional parameters may be added in the future, and we always welcome input from our user community on what they’d like to see.
The Palmar Metric
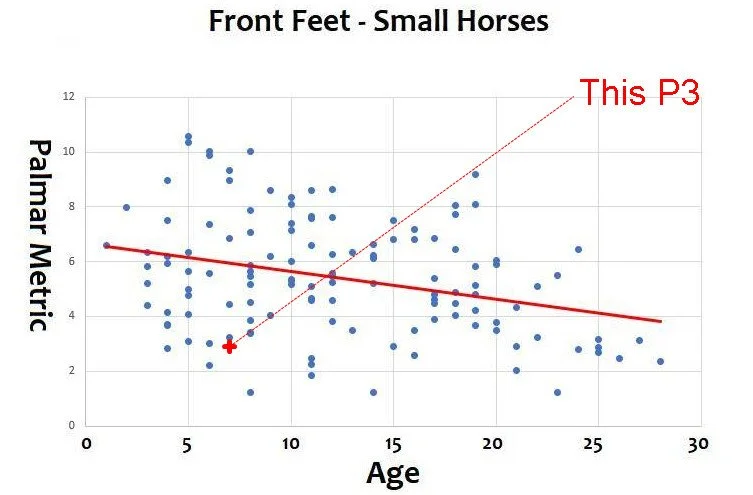
For front feet, a 3rd report page is generated. Page 3 of the report shows the result of analysis of the ‘Palmar Metric’. The 'Palmar Metric' measures the concavity of the palmar side of the P3 bone. In the graph, the red curve shows the average value for a population of horses as a function of age. As the graph shows, this metric tends to decrease as the horse ages. The red cross shows the P3 concavity computed for the given image. This can be a useful measurement as part of a pre-purchase report since it can detect a hoof for which the P3 has remodeled flatter than normal for its age. The blue curve traces out the top of the concavity of the P3 bone - the Palmar Metric is computed based on the area under this curve (down to the base line of the P3 bone). The scattered points are values for 530 mixed-breed horses. More details in our publication.
Trendline Curve
Based on the length of P2 we display a differing age-curve for smaller and larger horses. P2 length less than 1.6’ is considered a small horse. In this example image, the value is well below the trendline for a 7-year-old horse - so this pedal bone has remodeled flatter than the average 7-year-old. The Palmar Metric changes only slowly over the life of the horse, but we wish to minimize its rate of decline.

